Bonus Material: How to Reduce Cart Abandonment – 17 Advanced Strategies Guide
Optimizing conversion rates is top of mind for most eCommerce teams, and that makes sense.
Understanding how much (or how little) traffic turns into customers can help your team understand how all your marketing efforts are paying off — and how specific campaigns or creatives resonate with users.
As you plan your onsite strategy for 2022, you might be wondering how your brand’s conversion rates compare to others and whether yours are hitting the mark. Is there more you could be doing? Are you already at the top of your market?
What is a good conversion rate? 1%? 50%? Even more importantly, how do industry, device, and other factors impact conversion rate?
We analyzed 2 billion eCommerce browsing sessions per week across every eCommerce industry imaginable to compile the ultimate conversion rate statistics report.
Ready to see where you stand?
What’s The Average Conversion Rate for 2021?
Average Conversion Rates by Device
Black Friday/Cyber Monday Conversion Rates
Optimize Your eCommerce Conversion Rate for 2022
What’s The Average Conversion Rate for 2021?
Conversion rate refers to the percentage of site visitors who take a specific, desired action. For most eCommerce sites, the desired action is making a purchase, but for some, like ButcherBox, it’s signing up for a monthly auto-ship subscription.
Not every eCommerce conversion is a sale, however. Signing up for a newsletter to get a discount code, subscribing to SMS updates, or referring a friend through a loyalty program might also be considered conversions.
These smaller conversions that happen at different stages of the conversion funnel are typically considered micro-conversions.
The conversion rate statistics in this article report upon macro conversions, or purchases.
Remember that you will never reach a 100% conversion rate. Even the best converting eCommerce stores won’t convert the majority of their traffic.
So, what’s a good conversion rate in 2021?
According to data gathered from Namogoo’s network of over two billion sessions for the world’s leading eCommerce retailers, the average conversion rate across all industries between January 2021 and November 2021 was 2.9%.
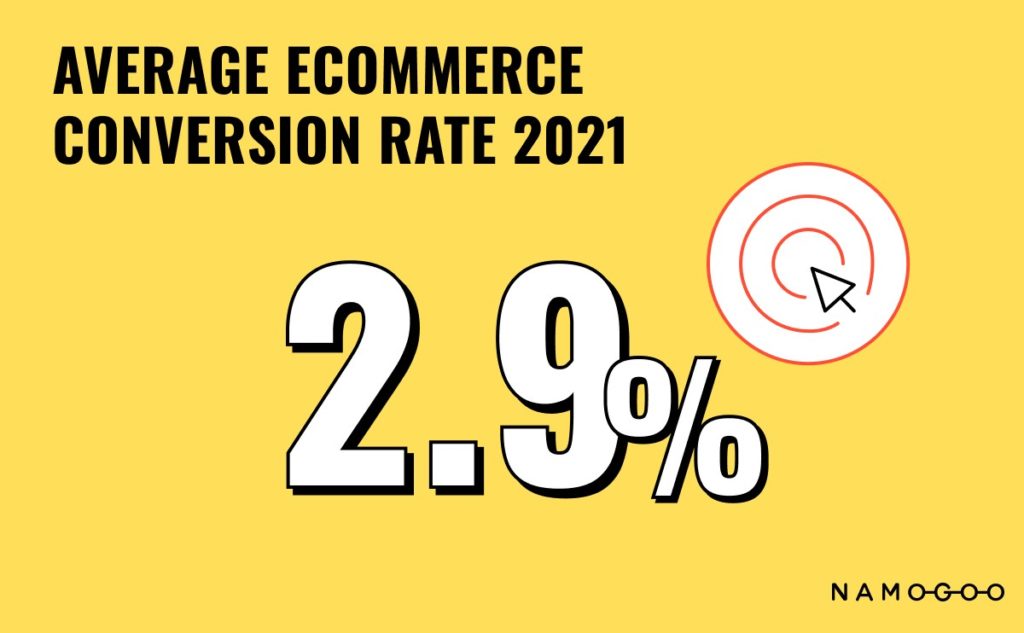
That means for every 100 people who visit your website, fewer than 3 will convert.
That difference in average conversion rates highlights why it’s important to dig deeper when comparing conversion rates.
It also begs the question — why is the average so low?
Conversion rate can be impacted by a variety of factors, including the channels through which you acquire traffic to your site, your customer’s purchase intention, and the onsite user experience. Some users are still in the research stage and will convert — but not yet. Others are window shopping and have no intention of converting.
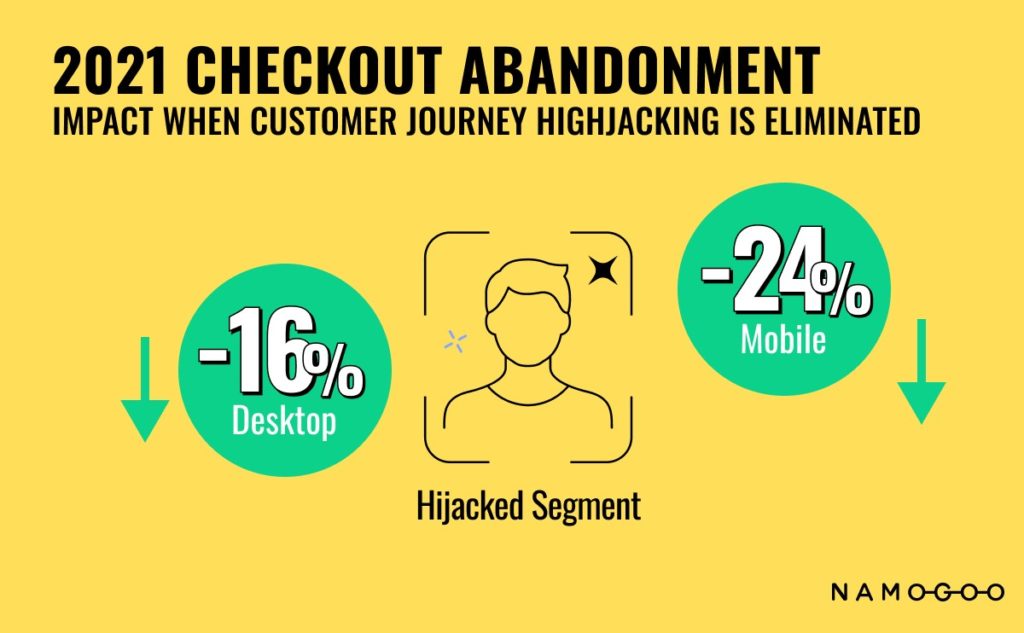
Another cause might be customer journey hijacking, which occurs when eCommerce site visitors see unauthorized ads (often for competitors) and are hijacked off the path to conversion.
Reducing hijacking and bringing those customers back can drastically improve your conversion rates. In fact, by eliminating customer journey hijacking, eCommerce sites see a marked decrease in checkout abandonment — 16% on desktop and more than 24% on mobile[*].
eCommerce users who are recovered (after being hijacked) have an average conversion rate of 6% — slightly better than overall eCommerce conversion rates.
As we look at conversion rates, we’ll also look at how well hijacked customers convert if they are brought back to a site. Customer Hijacking Prevention is Namogoo’s flagship offering, and the product through which these eCommerce conversion statistics are gathered.
Average Conversion Rate by Industry
The average conversion rate can vary drastically by industry.
For example, the overall average conversion rate is 2.9%, as mentioned earlier.
eCommerce stores in the travel industry have an average conversion rate of just 1.7%, while supermarkets have an average conversion rate of 11.1%.
Compare your conversion rates to the wrong metrics, and you could lead your business down the wrong path.
For example, a supermarket might think, “Oh, our conversion rate is 5%, that’s twice as good as average.” As a result, they make no effort to adjust their onsite strategy. In reality, a 5% conversion rate is terrible for their industry.
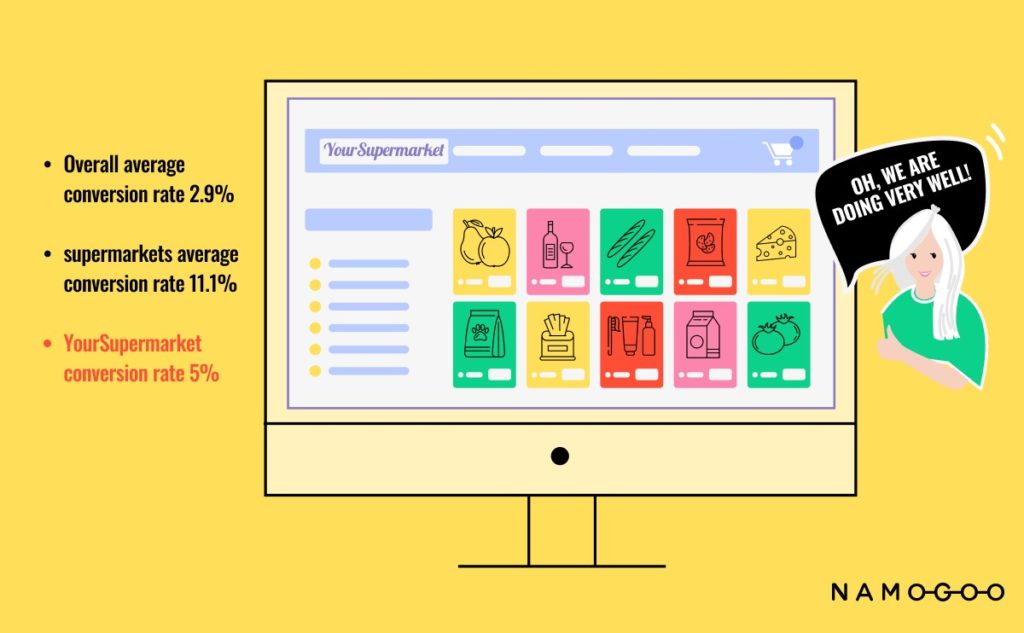
Conversion rate averages should serve as a starting point. To make strategic decisions, however, brands should consider the average conversion rate in their specific industry.
Average Conversion Rate: Health and Beauty
The health and beauty industry in the US is currently valued at more than $82 billion[*] with a projected annual growth of 4.06. TL;DR it’s a highly valuable, fast-growing industry.
So what do their conversion rates look like?
The average conversion rate in the health and beauty industry is 3.7%.
However, hijacked users who are brought back convert at 6.4% — meaning getting users back to your health or beauty site is a key strategy for increasing conversions.
Average Conversion Rate: Fashion, Apparel, and Footwear
Fashion and apparel is a broad category, so we’ll try to break it down a bit.
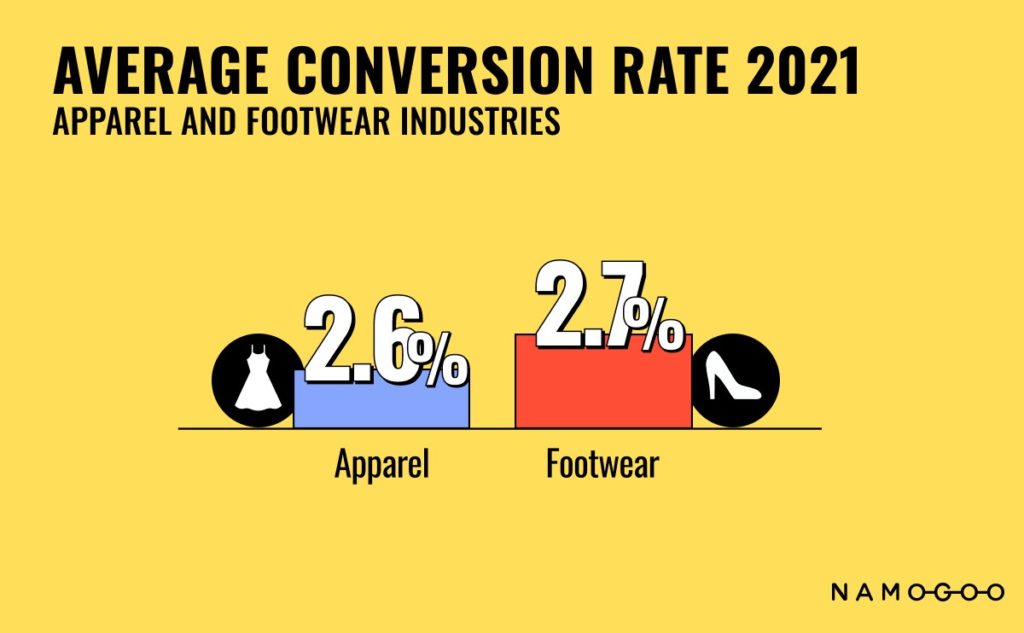
The average conversion rate for apparel brands is 2.6%. It’s worth noting this does not include footwear, just apparel. Recovered hijacked users, or those pulled off a site but then recovered, have a conversion rate of 4.6%.
Footwear sites see an average conversion rate of 2.7%. The conversion rate of recovered hijacked customers is 4.8%; much higher than the average conversion rate in that niche.
Average Conversion Rate: Tech and Office Supply
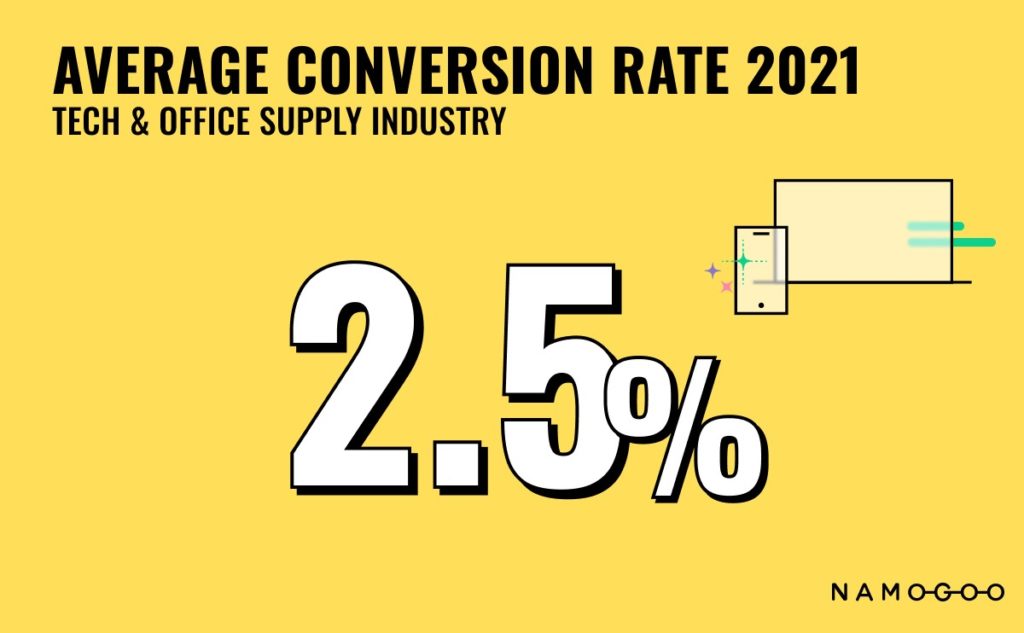
The total conversion rate for tech and office supply eCommerce stores is 2.5%, just below the overall average.
Recovered users convert at a lower rate, with an average conversion rate of 2.2%. Still, computers and other office supplies tend to be big-ticket items, so it’s still worth recovering those lost users.
Office and EI companies see an average conversion rate of 3.0% and a recovered user conversion rate of an impressive 6%, making recovering lost users a crucial strategy.
Average Conversion Rate: Retail
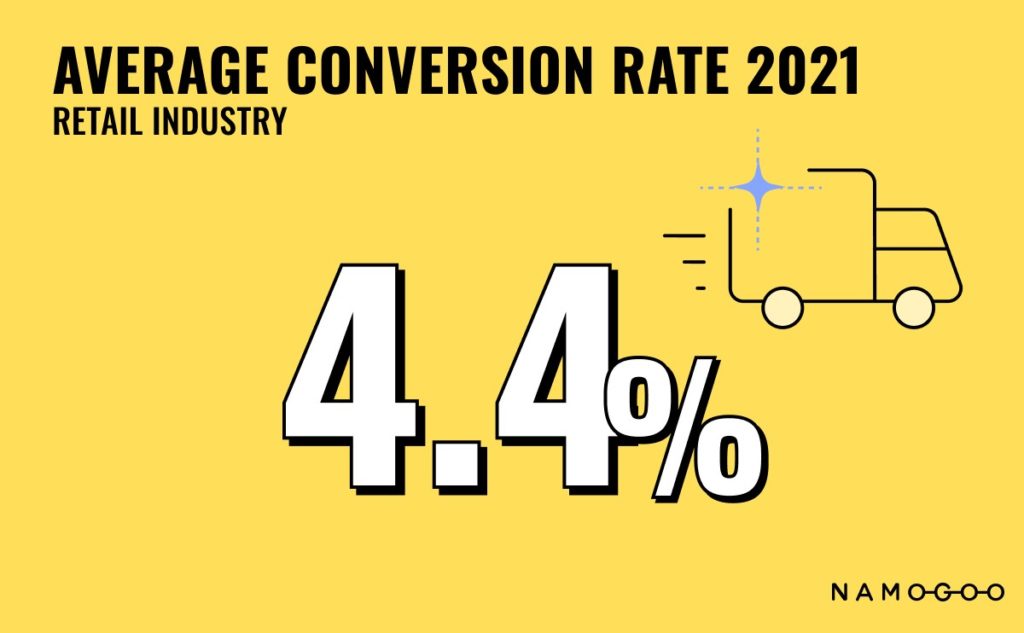
Retail conversion rates are also higher than average, with a total conversion rate of 4.4%. Interestingly, recovered hijacked users convert at a rate of 5.7%.
Conversion rates for recovered users are higher than overall conversion rates— making it a key focus for retail stores.
Average Conversion Rate: Gifts and Hobbies
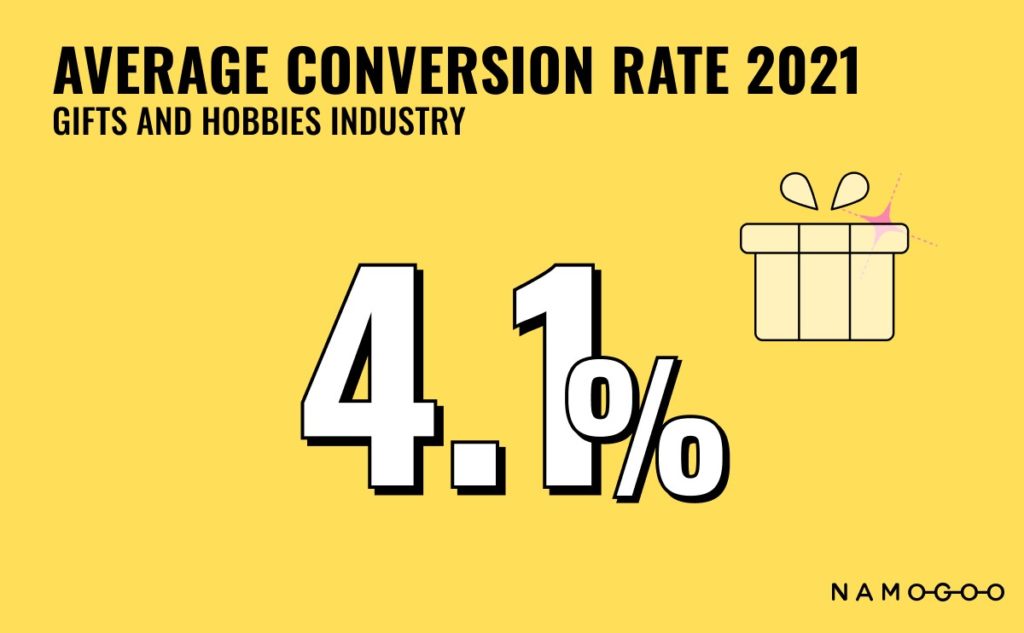
Stores in the gifts and hobbies industry have an average conversion rate of just 4.1% from January 2021 to November 2021.
The average Black Friday/Cyber Monday rate is lower, with a conversion rate of just 3.9% in 2020. Recovered hijacked customers during the same weekend convert at 6.2%.
Average Conversion Rates by Device
It’s no secret that mobile usage is on the rise. According to Statista, there are 4.32 billion mobile[*] users in the world. What does that mean for conversion rates?
It’s another factor to consider when tracking conversion rates.
71% of shoppers[*] prefer to shop on websites over native apps — and 39% shop on mobile devices, while 30% shop on a PC.
On Black Friday/Cyber Monday, 73% of online shoppers use mobile devices, and more than 56% of all conversions occur on a mobile device[*].
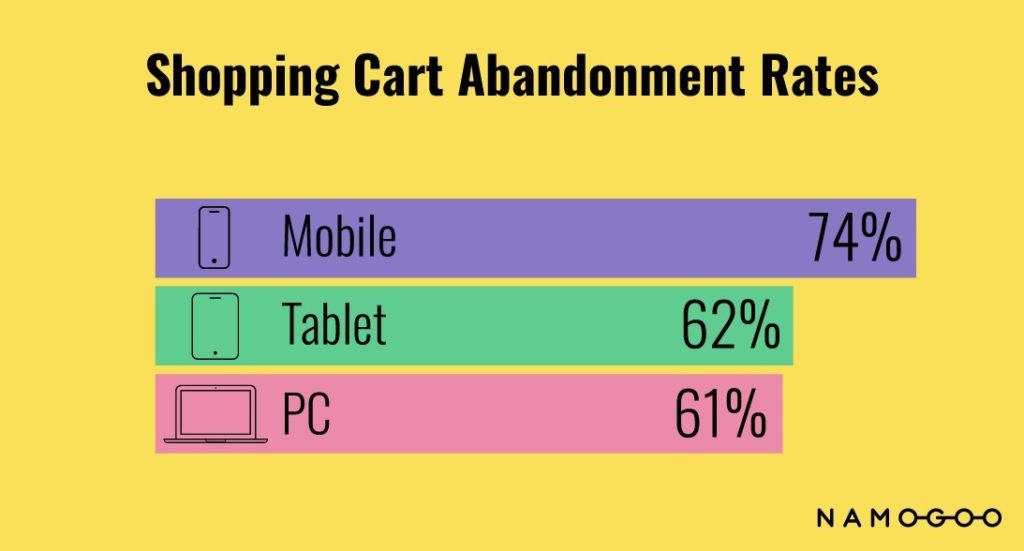
It’s also worth noting that 74% of shopping carts are abandoned on mobile — the highest of all devices. Average shopping cart abandonment rates by device:
- 74% mobile
- 62% tablet
- 61% PC
What does this mean for your 2022 onsite strategy?
If your site isn’t easy (and pleasant) to use on mobile devices, you could be killing your conversion rates. Additionally, if you rely on an app to drive sales, it might be worth reconsidering that strategy, as most users prefer to shop on websites.
Black Friday/Cyber Monday Conversion Rates
For eCommerce businesses, BFCM is crucial to overall profitability. This begs the question — do users convert more or less on these days?
Here are a few stats to keep in mind.
In 2020, online shoppers spent $9 billion[*] on Black Friday, a 22% increase from 2019. For eCommerce companies, this highlights the importance of improving conversion rates. Users are ready to spend — and they might head to your competition if you get it wrong.
Our analysis of more than two billion eCommerce store sessions found the average conversion rate for Black Friday in 2020 was 4.5%[*], compared to 3.8% in 2019. (And higher than the average!) US online stores had an average conversion rate of 4.3% in 2020, while the UK saw a much higher conversion rate of 6.1% in 2020.
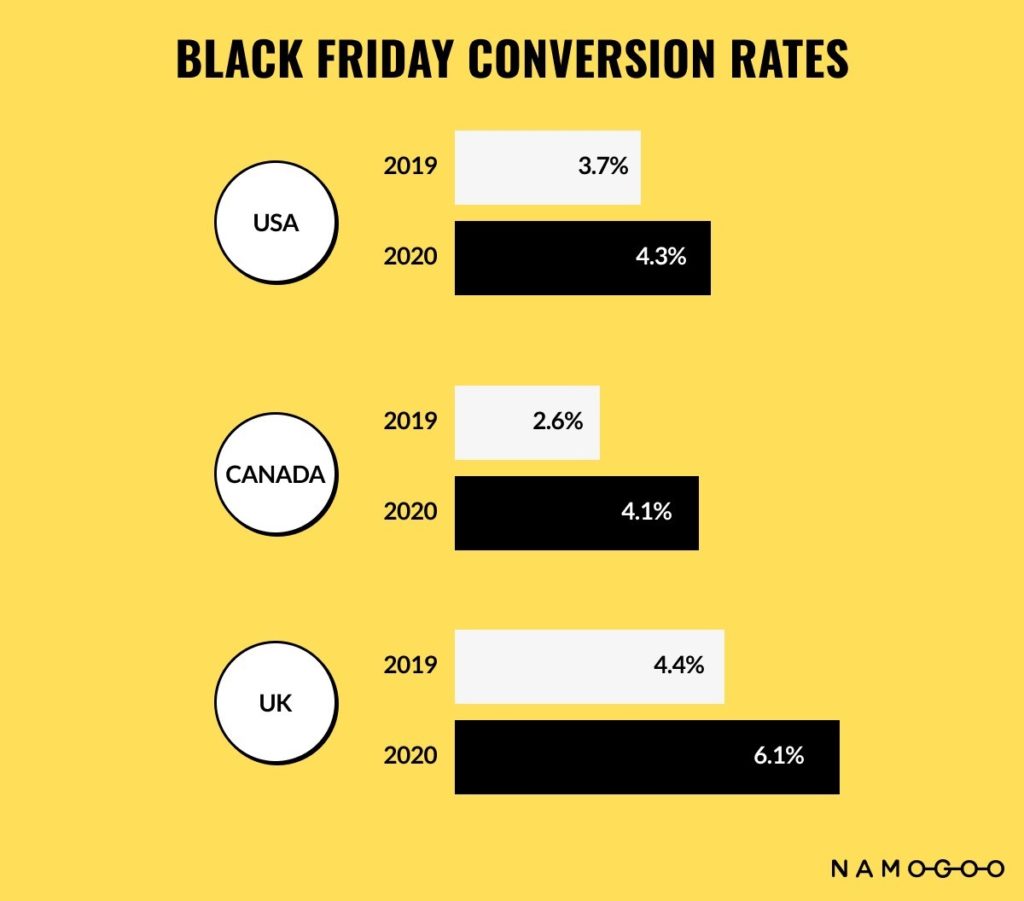
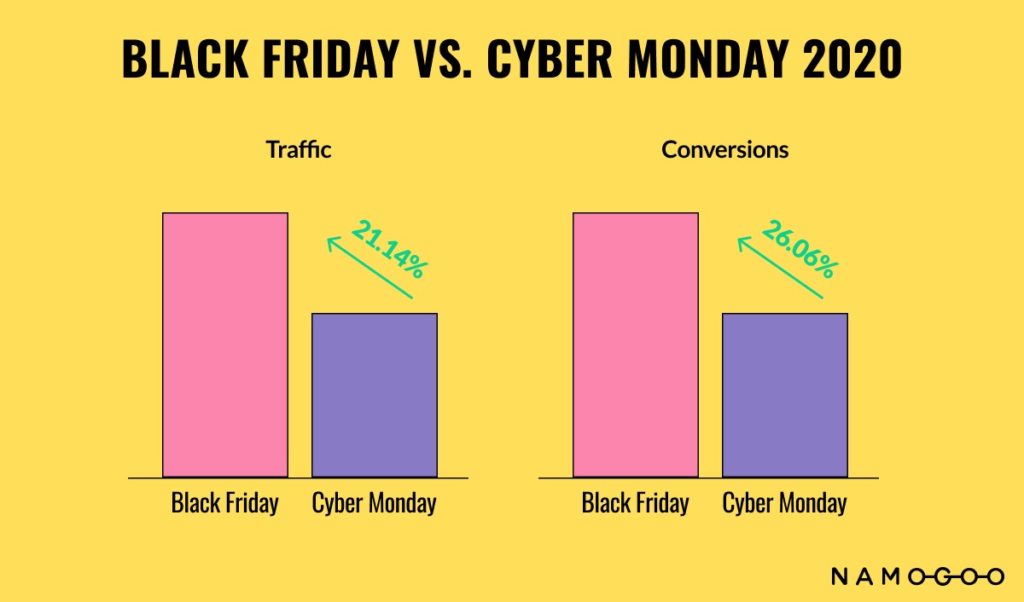
Conversion rates remain high through Cyber Monday. The overall average conversion rate from November 27th, 2020 (Black Friday) through Cyber Monday was 4.4%.
Let’s look at the average conversion rate for Black Friday 2020 by industry:
- Fashion and apparel 6.6%
- eCommerce:
- Retail: 2.8%
- Health and Beauty: 13.1%
- Insurance: .9%
- Lifestyle: 5.3%
- Gift & Hobbies: 3.8%
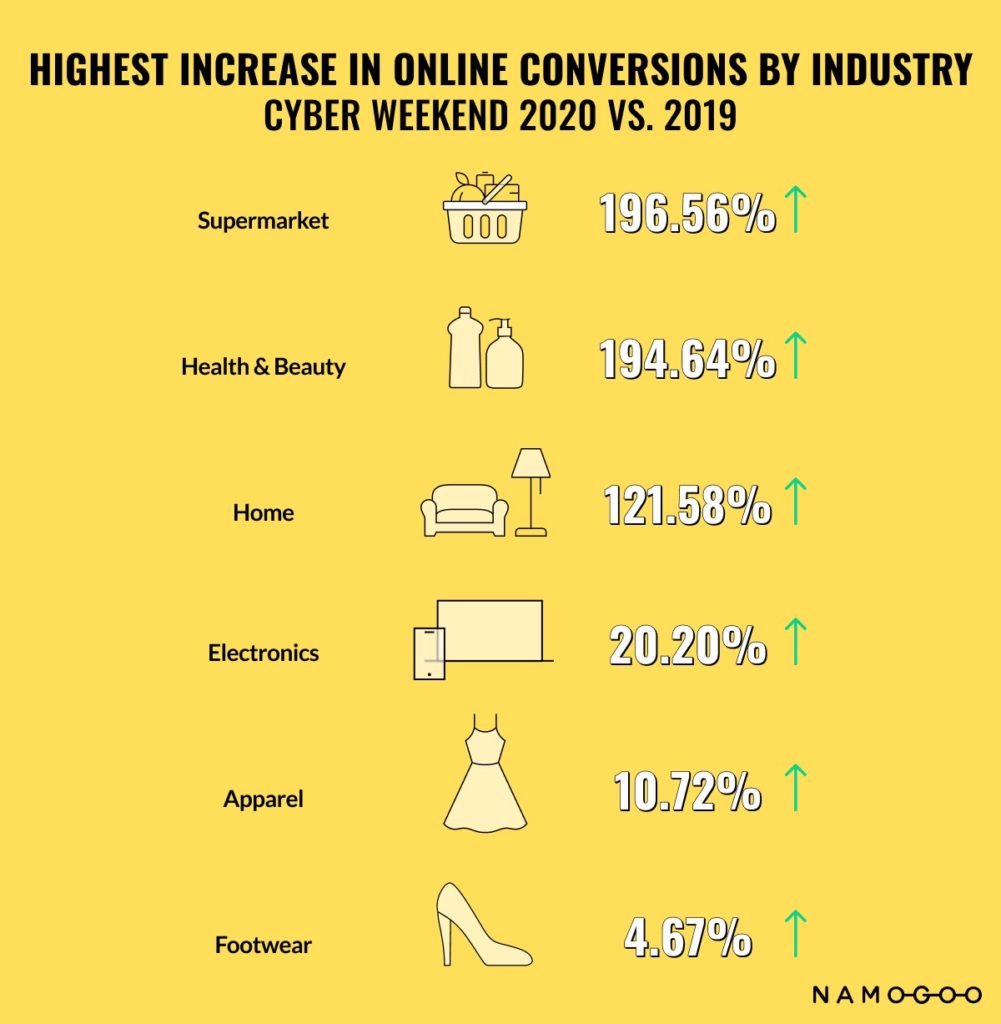
As you can see, not all industries should be as concerned with Black Friday. Insurance, for example, doesn’t do very well. (Which is not surprising.)
Fashion, health and beauty, and gifts, and hobbies have higher than average conversion rates during Black Friday, making it more important to optimize your site and recover lost users.
Optimize Your eCommerce Conversion Rate for 2022
Conversion rates are a hot topic for eCommerce brands. This makes sense — the higher your conversion rates, the higher your profits.
However, looking at average conversion rates isn’t as useful as considering conversion rates by industry, device, or even season.
In addition to understanding the average conversion rates, organizations should consider the conversion rate of recovered users. In many cases, recovered users convert at a much higher rate.


