As digital commerce executives look back at 2018 and analyze how well their eCommerce platforms fared during each quarter and critical shopping period, they’ll be looking to glean lessons learned — not only from their own data but from industry benchmarks as well — so they can feed them back into their strategies and upcoming promotional campaigns with an eye to achieving gains throughout 2019.
Regardless of which strategy you swear by to plan, analyze, and continuously improve your eCommerce performance, quality data is the core ingredient needed to drive your decisions towards a successful outcome. While digging into your sales funnel metrics, dissecting each part of your customer journey, and measuring the ROI of each solution added to your eCommerce experience provides copious amounts of data needed to plan for improvement, there’s still a large missing factor – Customer Journey Hijacking.
This client-side phenomenon, in which unauthorized product ads, banners and pop-ups are injected into consumer browsers, disrupts site visitors with invasive promotions, the majority of which lead to competitors, damaging online retailers’ conversion and revenue and leaking their digital investments. In fact, 20% of all your web traffic over the past year is exposed to these disruptions — and they’re skimming the conversion and revenue you work so hard to achieve.
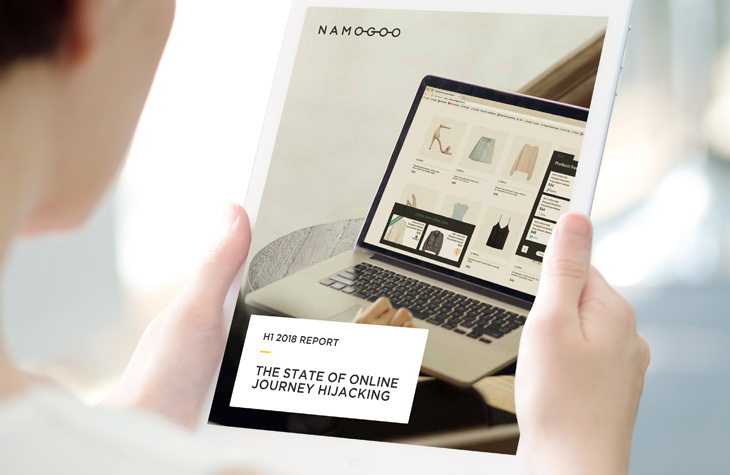
As the pioneer in Customer Journey Hijacking prevention, a key part of our market education efforts here at Namogoo is to equip eCommerce executives with this critical data so that they can gain a clear grasp of how this debilitating problem impacts their customers and their business metrics. Following our H1 2018 report, our latest edition of The State of Customer Journey Hijacking provides a full recap on the scale and impact of unauthorized injected ads throughout 2018, and slices this data by region, device, browser, and industry vertical.
Based on analysis of hundreds of millions of web sessions every week, this biannually published report puts the impact of this problem into perspective as well as the gains online brands can make by solving it. Some of the key findings discovered in 2018 include:
- Users on all major desktop web browsers exhibited high infection rates. Apple Safari users were the most impacted for both desktop and mobile browsers with infection rates of 24.66% and 19.19% respectively.
- 2018 desktop infection rates were highest in the U.S. in the critical fourth quarter encompassing the peak holiday season shopping period, with 21.57% of all user sessions exposed to unauthorized ads. European desktop infection rates highest in Q2 at 22.56%
- Desktop users in 2018 were most infected with injected ads when browsing online marketplaces (25.72%) and home retailer (23.13%) websites
- Mobile users were most impacted when browsing footwear websites at 21.63%.
- Online marketplaces were most impacted by Customer Journey Hijacking during Q4 2018 covering the holiday shopping season, with 32.94% of desktop sessions and 25.05% of mobile sessions disrupted by injected ads.
- Visitors to subscription-based websites and online marketplaces were most exposed to invasive ads throughout 2018 with infection rates of 43.26% and 34.07% respectively.
- Infected users on both desktop and mobile convert at over double the rate of clean users after Customer Journey Hijacking has been blocked from interrupting their online experience.
Download the full benchmark report to get in-depth data on how infected online customers are impacted across devices, browsers, and regions, and to find out how your vertical is affected.


